Bawdy Trade in New Orleans, 1840s-1950s
Instruction and User Experience Librarian Victoria Elmwood's digital mapping project to imagine a century of sex work in New Orleans. The Research Guide presents a bibliography, recommended reading and research resources, and instructions for using three Google Earth maps (.kmz files) containing images, links, and annotations of locations related to prostitution in New Orleans in the 1840s-1950s.
All Out: Mapping U.S. LGBTQ+ Movements

As a complement to the traditional research paper, Lucy Rosenbloom and Jason Ezell piloted a digital map-making assignment for the honors course, Beyond Stonewall: U.S. Gay Liberation. Their pedagogical project explored the potential of librarian-instructor collaborations and digital scholarship in the first year seminar. As a result, their students learned to plot historical research geographically and to share their collective work more widely, producing a far more complex map of U.S. LGBTQ+ movements than do histories which focus on a handful of iconic sites.
The class project can be found here: All Out: Mapping U.S. LGBTQ+ Movements. Students used both Google My Maps and Storymap JS.

New Orleans Opera Association Timeline
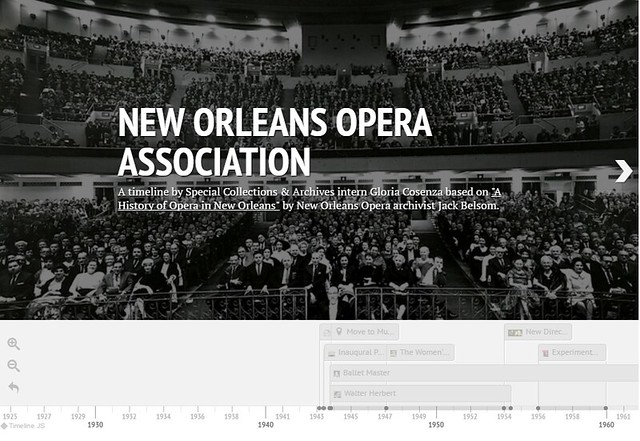
The timeline above (click to open in a new window) was created by music major and Special Collections & Archives intern Gloria Cosenza in conjunction with the Fall 2016 exhibit, "Encore! Encore! Bravi! Presenting the New Orleans Opera Association Archives." Gloria used TimelineJS to create the digital timeline.
Stanford LitLab Pamphlets

English faculty member Sarah Allison has published two pamphlets with the Stanford LitLab. The first pamphlet, "Quantitative Formalism" mapped nineteenth-century genres in relation to one another using multivariate analysis to re-express literary genre as set of shared stylistic features. The fifth pamphlet, "Style at the Scale of the Sentence," makes the sentence the central unit for the study of style. Both pamphlets are available at the Stanford LitLab website as well as in n+1 (here and here).
Mapping Global History
Students in Allison Edgren and Rachel Wallace's courses have used timeline and mapping software to create collaborative data visualizations. In Fall 2020, students in Global History and 1960s In The US And Europe used the free online resource TimeMapper to document both the time and location of historic events.

In Spring 2021, students in Queer History and Culture and US History from 1965 used TimelineJS, another free platform, to create timelines.

Digital mapping and timeline projects can help facilitate student learning by connecting the students to actual places and spaces more robustly than by just reading about events.
Janet Mary Riley Digital Exhibit

Special Collections & Archives intern Brittney Giardina created this digital exhibit based on the 2017-2018 Special Collections & Archives exhibit using Omeka software.
Mongol Music Archive

Honors student Dimitri Staszewski raised money through Kickstarter to travel to Mongolia and film and record Mongolian music. His website, which includes videos, photos, and writing, was built using Wordpress.org.
Projects at Other Institutions
-
Mapping Early American Elections (Ray Rosenzweig Center for History and New Media at George Mason University)"Explore how Americans voted for their legislators, 1787–1825."